Baywatch actors, including David Hasselhoff and Pamela Anderson, are running on a beach on the Pacific coast of California, at sea level, in 1989. In the new Baywatch production released in 2017, this time with actor Dwayne Johnson (The Rock) accompanied by other attractive actors, the sea level rose by 10 cm compared to the first production, but it seems that this is not the reason why the series did not enjoy the same success.
Even if the increase doesn’t seem like much, barely reaching the level of the actors’ ankles, relative to the surface of the Planetary Ocean, it means a surplus of 36,000,000,000,000,000,000 liters of water, i.e. 36 quarts of liters of water or 144 million Olympic swimming pools full of water. This increase in water volume continues today and is largely due to human activities.
Sea level is important
In addition to the attractive actors, the sea is the highlight of the Baywatch series. The series boasts beaches full of sun, shallow water ideal for swimming, and recreational activities such as windsurfing. Sea level is one of the essential interfaces of the Earth. Life forms, sedimentary deposits and geology all depend on and are influenced by this interface.
In addition, human civilization is essentially maritime. Ancient ports flourished because they benefited from easy long-distance freight transportation, and this has remained unchanged to this day, allowing us to stock up on most of China’s consumer goods. Transportation along with easier access to resources has led to the largest concentrations of people in coastal areas, where we find megalopolises such as New York, Tokyo, Shanghai, London and Laos. Therefore, it is important to know what happens at sea level, even if we live on land, far from the sea, because the flooding of the shores will lead to a disruption of the entire global economic and social system.
Sea level is measured today by satellite
The range between the two Baywatch series has been covered almost entirely by accurate and global measurements of sea level made using satellites. Since the launch of the first ocean-level satellite in 1993 and until now, a fleet of satellites (such as Jason) have joined the mission to map the surface of the oceans with a 10-day recurrence.


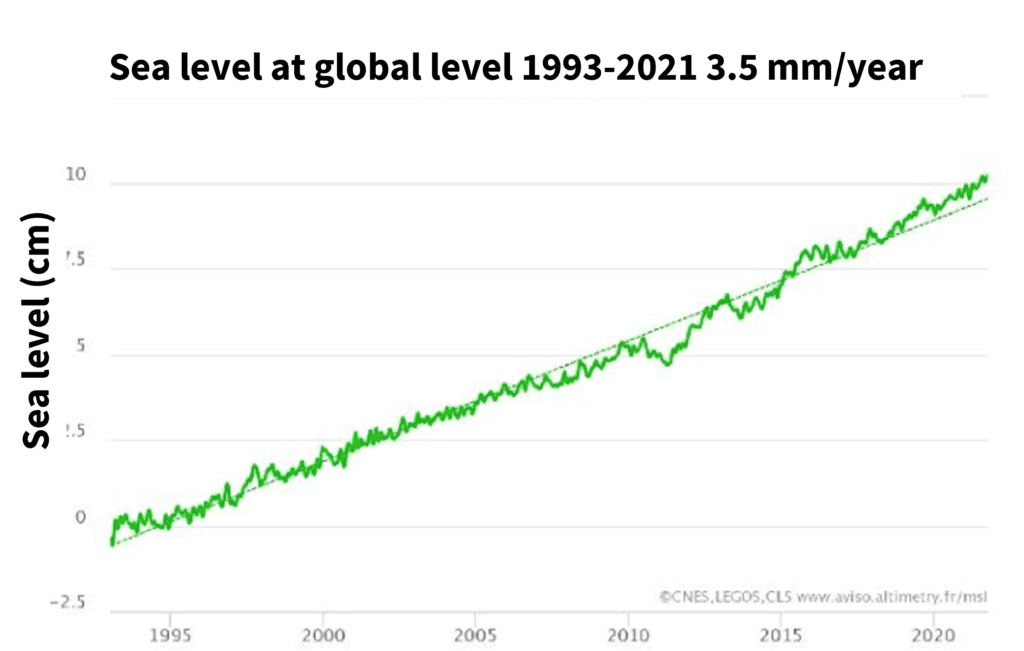
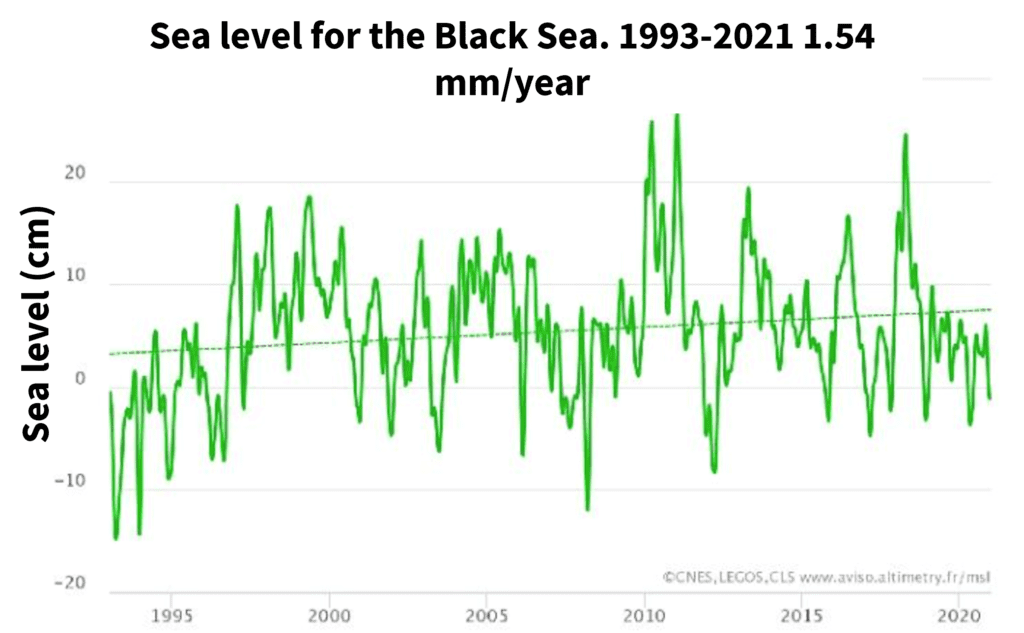
The evolution of the global sea level over the last three decades can be approximated by a continuous line, with an average increase of 3.5 mm/year according to the latest data, and slightly accelerating. Instead, the dynamics of sea level are much more complicated when we consider a semi-closed basin such as the Black Sea that communicates with the Mediterranean through the Bosphorus and Dardanelles and then with the Planetary Ocean through the Strait of Gibraltar. The level of the Black Sea is strongly influenced by local factors such as the flow of the Danube and other tributary rivers, atmospheric pressure or evaporation, which makes the variations much stronger, +/- 10 cm in a few years, but with an increasing trend overall lower compared to the planetary evolution (+1.54 mm / year).

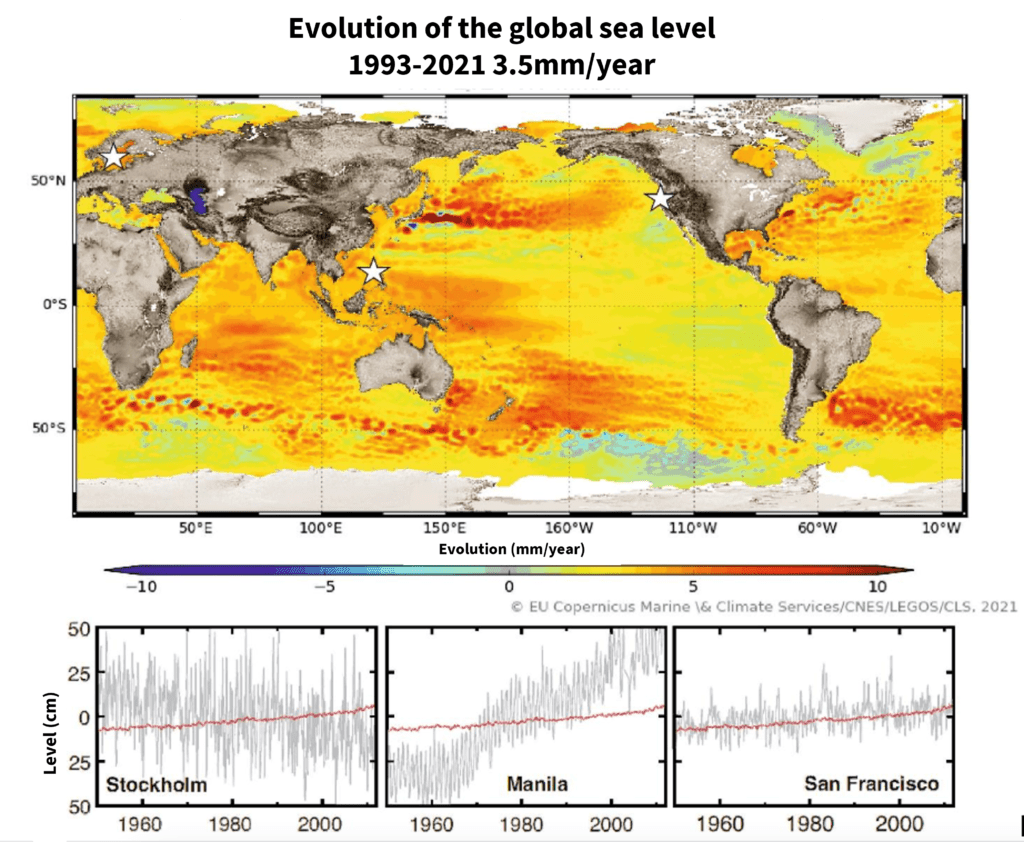
In fact, few areas of the globe record an exact increase of 3.5 mm/year. The increase in most areas is either above or below this value and is due to ocean and atmospheric dynamics. For example, the eastern Pacific Ocean increases by 1 mm/year while the western part by 5 mm/year. The difference is due to the intensity of the La Nina and El Nino phenomena of this period, which modulate the wind speed and “push” the water masses further to the west.
Currents also migrate and change in intensity with cyclonic and anticyclonic vortices. They change position and intensity and appear on the map as more colorful freckles.
Regions in the Southern Ocean near Antarctica, with the melting of the ice cap, are paradoxically declining, even if water is released. Melting the cap actually causes a decrease in gravity, and therefore of the gravitational attraction of water in this area.
Sea level measured at the shore is relative
If today, satellites allow us to have an absolute view of sea level all over the Earth, at millimeter resolution, in the past, measurements were made only with the help of tide gauges (mareographs), located near coastal cities. The oldest tide graphs are in Amsterdam (as early as 1700), Liverpool (1768), Stockholm (1774), and Sulina for the Black Sea in the 19th century.
On shore, however, things are even more complicated. Tide gauges present an intrinsic problem, they measure the relative sea level, i.e. in relation to the geological substrate on which it is located, and not at an absolute ‘0’ level. Therefore, local subsidence and sediment compaction or tectonics strongly affect tidal trends. For example, in Stockholm, the sea level is falling due to a phenomenon called glacial isostatic uplift. It is connected to the earth’s crust, which has in the past been pushed downwards by the ice cap. Once the crust was released from the ice after the ice age, it began to rise, and implicitly the relative sea level dropped. Manila is an example in which local anthropogenic subsidence and water extraction have led to the sinking of the city by half a meter, respectively the increase of the relative sea level with the same value.
Past sea level
Knowledge of sea level near cities is not limited to the recent period. Using biological markers, one can know the evolution of the relative level since antiquity.
Excavations in the port of Marseilles (France) have brought to light the upper limit of a marine crustacean (Balanus) that was fixed on the poles of the Roman wharves of the port. Its upper part indicates the maximum level that the sea level can reach taking into account periodic variations such as tides. By measuring the higher altimeter difference between fossil and contemporary populations, it is possible to deduce with 5cm accuracy the antiquity sea levels. Radiocarbon dating (14C) can constrain the time horizon in which that crustacean grew. Applying this method, research in Marseilles has shown that the sea level of 5000 years ago was 1.5 m lower, similar to many of the ancient Mediterranean ports that are now covered by the sea.
Future sea level
Venice, a city close to sea level 0, is particularly vulnerable to rising sea levels. Exceptional floods, which occur at high tides with storms, are becoming more frequent. Since 1872, when such records began being kept, there have been 25 floods. Two-thirds of these have been recorded in the last 20 years, and one-fifth of the total over the period November 12 – December 23, 2019. For Venice, even a seemingly insignificant increase of a few centimeters detectably increases the frequency of floods.
Models that take global warming into account predict the probability of a sea-level rise from 0.5 to 1 m in 2100. A recent study, based on the most accurate global topographic data, estimates that 410 million people will be affected by the growing frequency of floods due to rising sea levels.
___
This is a translated article from our Content Partners InfoClima. The original article is written by Dr. Florin Zăinescu and can be found, in Romanian, here.


